

Guide (New 2026) Actual Microsoft PL-300 Exam Questions
PL-300 Exam Dumps Pass with Updated 2026 Certified Exam Questions
NEW QUESTION # 179
You have a Power Bi data model that imports data from a Microsoft Excel spreadsheet. You use Power Query to load a query that contains both renamed and custom columns. Later you attempt to reload the query and receive the following error message Expression.Error; The column 'Category' of the table wasn't found.
What are two possible causes of the error? Each correct answer presents a complete solution. NOTE: Each correct selection is worth one point.
- A. The data type of the column was changed
- B. The file is no longer in the specified location
- C. The column was removed from the source 'lie.
- D. The column was renamed in the source tile.
Answer: C,D
NEW QUESTION # 180
You open a query in Power Query Editor.
You need to identify the percentage of empty values in each column as quickly as possible.
Which Data Preview option should you select?
- A. Column distribution
- B. Column profile
- C. Column quality
- D. Show whitespace
Answer: C
Explanation:
Explanation
Column quality: In this section, we can easily see valid, Error and Empty percentage of data values associated with the Selected table.
Note: In Power Query Editor, Under View tab in Data Preview Section we can see the following data profiling functionalities:
* Column quality
* Column distribution
* Column profile
Reference:
https://community.powerbi.com/t5/Community-Blog/Data-Profiling-in-Power-BI-Power-BI-Update-April-2019/
NEW QUESTION # 181
Note: This question is a part of a series of questions that present the same scenario. For your convenience, the scenario is repeated in each question. Each question presents a different goal and answer choices, but the text of the scenario is exactly the same in each question in this series.
Start of repeated scenario
You have a Microsoft SQL Server database that has the tables shown in the Database Diagram exhibit.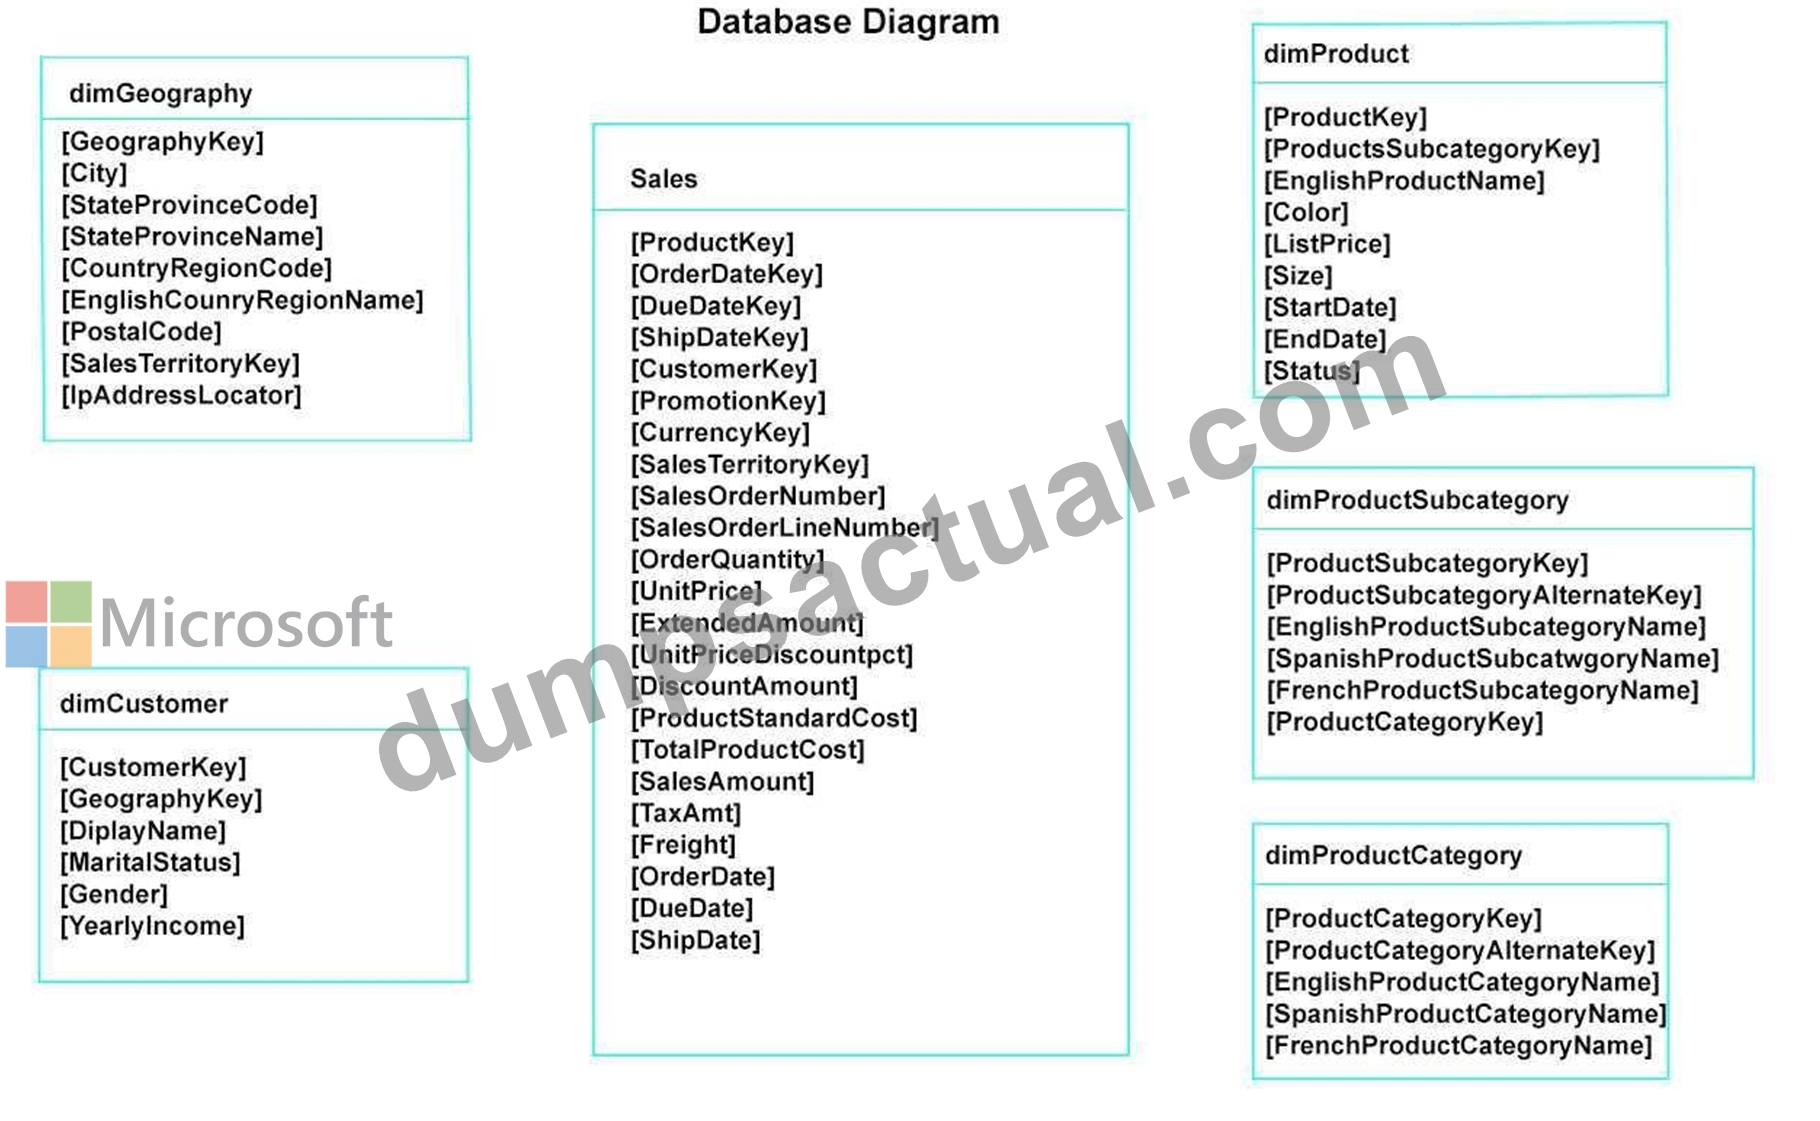
You plan to develop a Power BI model as shown in the Power BI Model exhibit.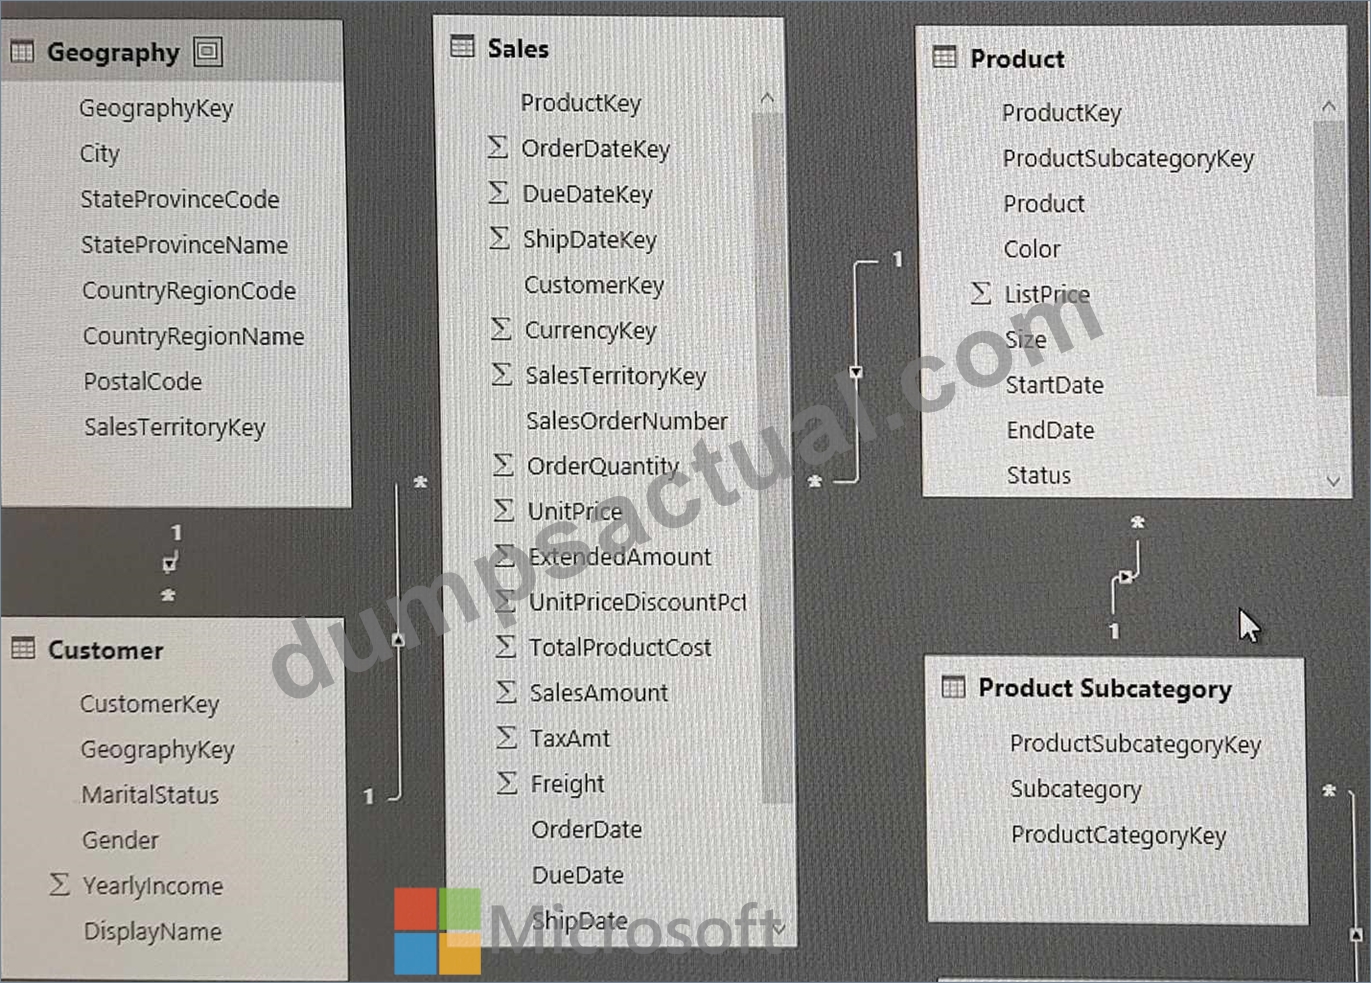
You plan to use Power BI to import data from 2013 to 2015.
Product Subcategory [Subcategory] contains NULL values.
End of repeated scenario.
You implement the Power BI model.
You need to add a measure to rank total sales by product. The results must appear as shown in the following table.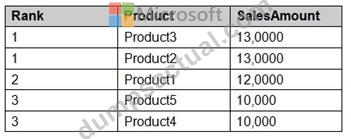
Which DAX formula should you use?
- A. Product Ranking= RANKX (ALL, (`Product'), [SalesAmount], , DESC, Skip)
- B. Product Ranking= RANKX (ALL, (`Product'), [SalesAmount], , DESC, Dense)
- C. Product Ranking= RANKX (ALL (`Product'), [SalesAmount], , Asc, Dense
- D. Product Ranking= RANKX (Product, [SalesAmount], , DESC, Skip)
Answer: B
Explanation:
Reference: https://msdn.microsoft.com/en-us/library/gg492185.aspx
NEW QUESTION # 182
You have a Power Bl workspace named Workspace1 that contains a dataset named DS1 and a report named RPT1.
A user wants to create a report by using the data In DS1 and publish the report to another workspace.
You need to provide the user with the appropriate access. The solution must minimize the number of access permissions granted to the user.
What should you do?
- A. Share RPT1 with the user.
- B. Grant the Build permission for DS1 to the user.
- C. Add the user as a member of Workspace1.
- D. Add the user as a Viewer of Workspace1.
Answer: B
Explanation:
Power BI provides the Build permission as a complement to the existing permissions, Read and Reshare. All users who already had Read permission for datasets via app permissions, sharing, or workspace access at that time also got Build permission for those same datasets. They got Build permission automatically because Read permission already granted them the right to build new content on top of the dataset, by using Analyze in Excel or Export.
With this more granular Build permission, you can choose who can only view the content in the existing report or dashboard and who can create content connected to the underlying datasets.
If your dataset is being used by a report outside the dataset workspace, you can't delete that dataset. Instead, you see an error message.
Reference:
https://docs.microsoft.com/en-us/power-bi/connect-data/service-datasets-build-permissions
NEW QUESTION # 183
You have a Power BI report that contains four pages.
All the pages contain a slicer for a field named Country,
You need to ensure that when a user selects a county on page l, the selection is retained on page 2 and page 3. The solution must prevent page 4 from being affected by selections on the other pages, What should you do?
- A. Move the Country slicer from page 2 and page 3 to page 1.
- B. Remove the Country slicer from page 1, page 2, and page 3. Add the Country field to the report-level filters.
- C. Remove the Country slicer from page 1, page 2, and page 3. Add the Country field to the page-level filters.
- D. Sync the Country slicer on page 1, page 2, and page 3,
Answer: D
NEW QUESTION # 184
You are creating reports in Power BI Desktop. The model has the following tables.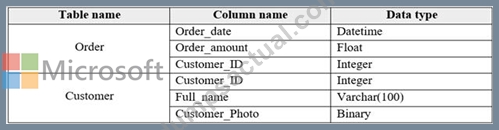
There is a relationship between the tables.
You plan to publish a report to the Power BI service that displays Order_amount by Order_date by Full_name.
You need to ensure that only the columns required for the report appear in Report View. The solution must minimize the size of the dataset that is published.
How should you configure the columns in Power BI Desktop? To answer, select the appropriate options in the answer area.
NOTE: Each correct selection is worth one point.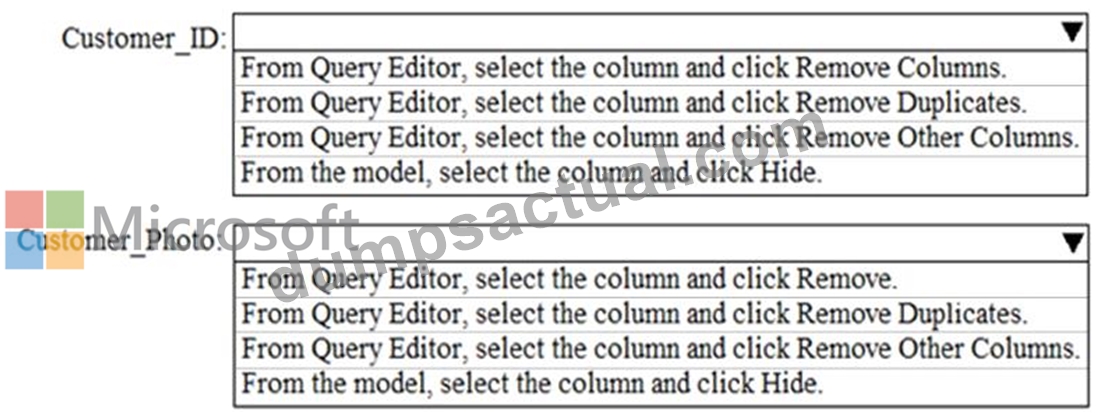
Answer:
Explanation: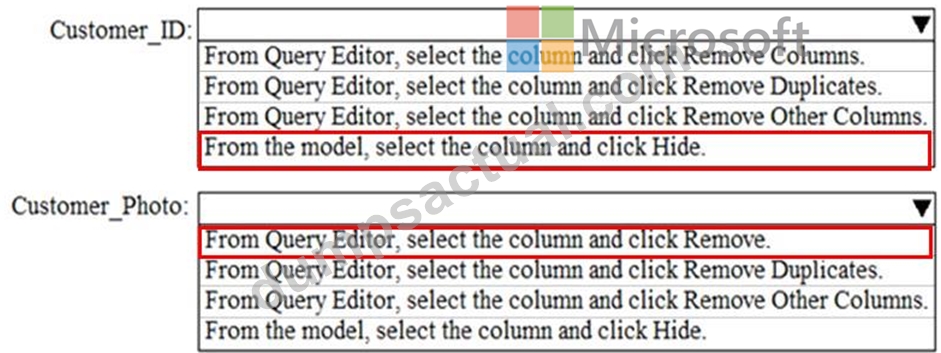
NEW QUESTION # 185
You are using Performance analyzer to analyze the performance of a visual in a Power BI report:
You need to identify the following log information:
* The time spent to retrieve data from a source
* The time required to wait for other visuals to complete
Which task categories should you review? To answer, select the appropriate options in the answer area.
NOTE: Each correct selection is worth one point.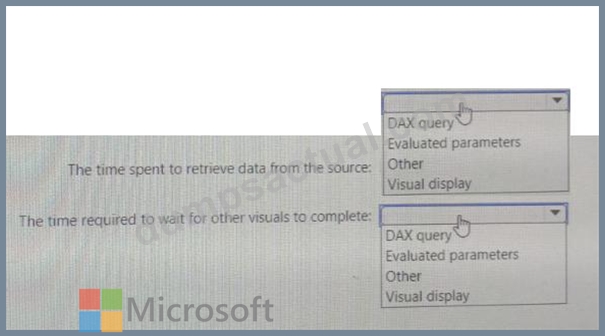
Answer:
Explanation: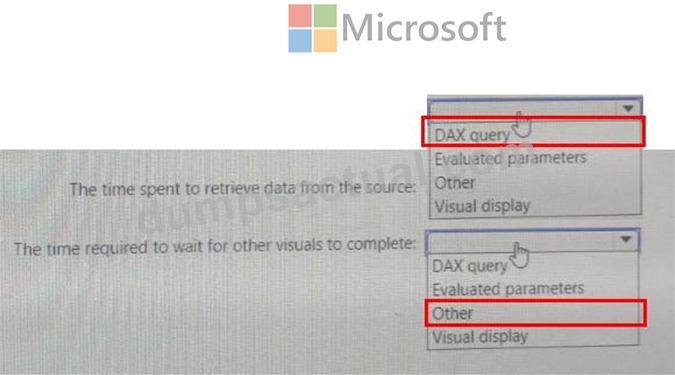
NEW QUESTION # 186
You are developing a sales report that will have multiple pages. Each page will answer a different business question.
You plan to have a menu page that will show all the business questions.
You need to ensure that users can click each business question and be directed to the page where the question is answered. The solution must ensure that the menu page will work when deployed to any workspace.
What should you include on the menu page?
- A. Create a button for each business question and set the action type to Bookmark.
- B. Create a Power Apps visual that contains a drop-down list. The drop-down list will contain the business questions.
- C. Create a text box for each business question and insert a link.
Answer: A
Explanation:
When you create a bookmark, the following elements are saved with the bookmark: - The current page - Filters - Slicers, including slicer type (for example, dropdown or list) and slicer state - Visual selection state (such as cross-highlight filters) - Sort order - Drill location - Visibility of an object (by using the Selection pane) - The focus or Spotlight modes of any visible object
NEW QUESTION # 187
You plan to create the chart shown in the following exhibit.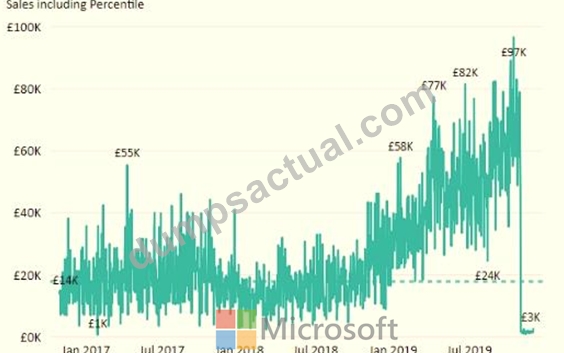
How should you create the dashed horizontal line denoting the 40th percentile of daily sales for the period shown?
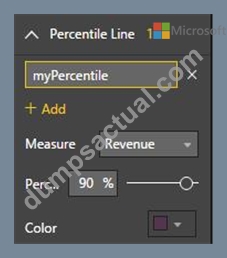
- A. Add a new percentile line that uses Total Sales as the measure and 40% as the percentile.
- B. Create a horizontal line that has a fixed value of 24,000.
- C. Add a measure to the visual that uses the following DAX expression.
Heasurel = PERCENTILEX.INC (Sales,Sales[Total Sales],6.40) - D. Add a measure to the visual that uses the following DAX expression.
Heasurel - PERCENTUEX.EXC (Sales,Sales[Total Sales],6.40)
Answer: A
Explanation:
The analytics feature enables you to show percentiles across groups specified along a specific axis.
Example:
1. Click on the analytics tab
2. Select Percentile
3. You can choose a specific percentile along with other formatting options.
4. Drag a date or non-numeric dimension into the Axis of a column chart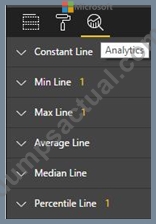
Add percentile lines to monitor daily revenue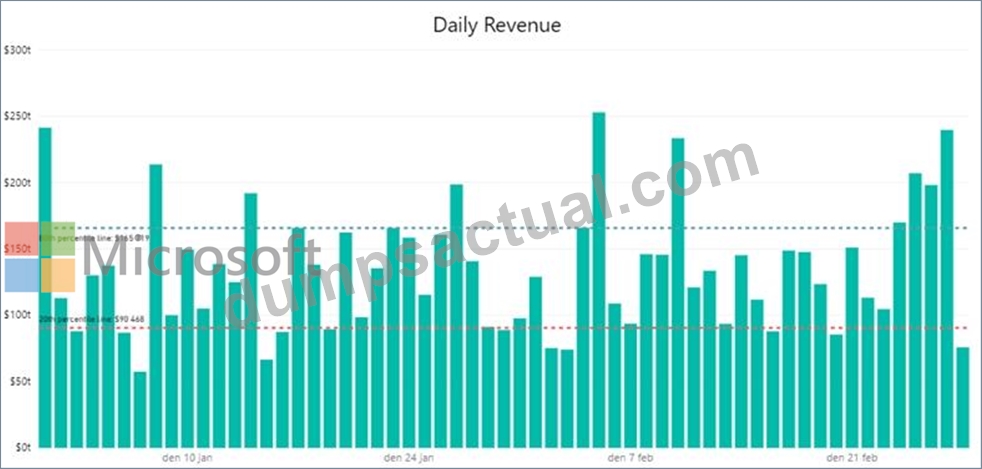
NEW QUESTION # 188
You have a report in Power BI Desktop as shown in the following exhibit.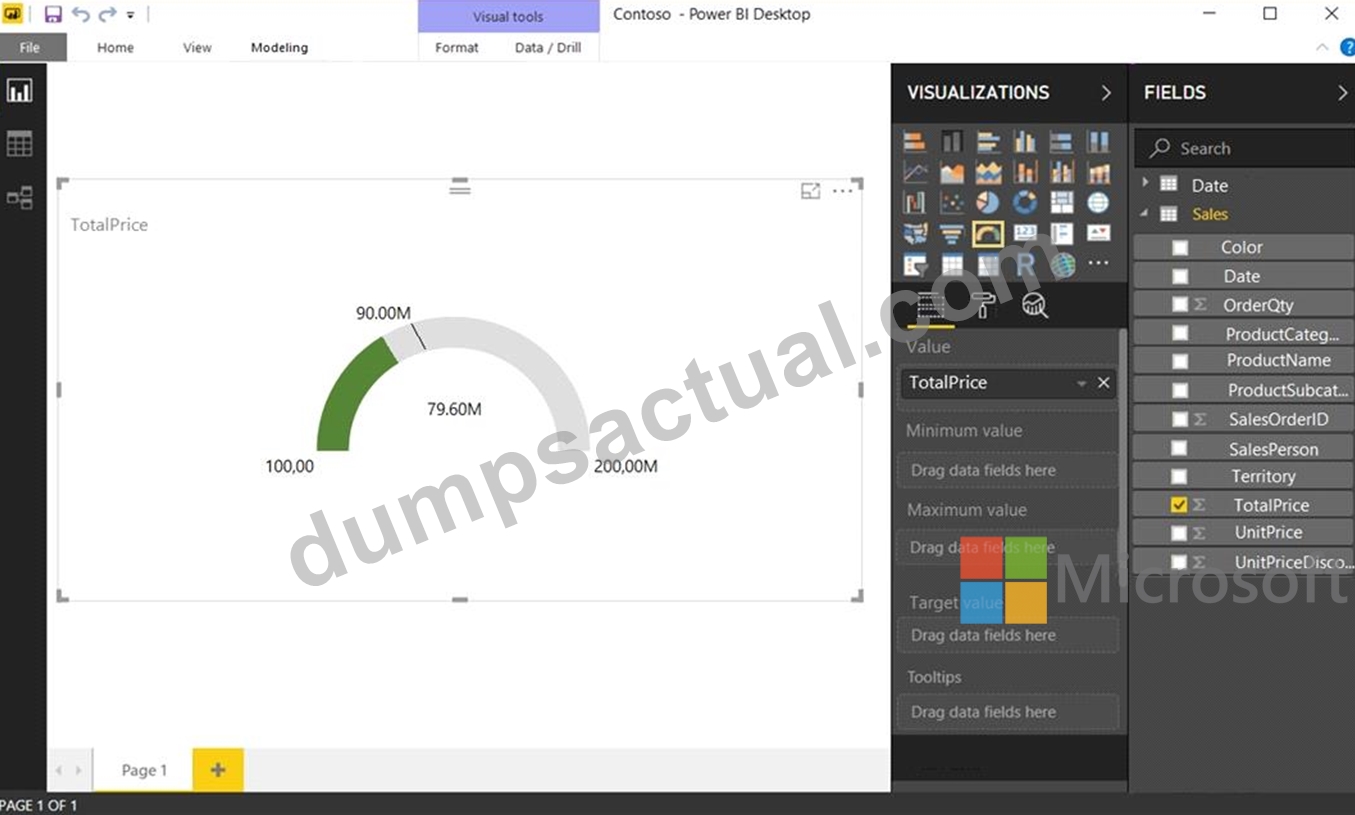
Use the drop-down menus to select the answer choice that completes each statement based on the information presented in the graphic.
Note: Each correct selection is worth one point.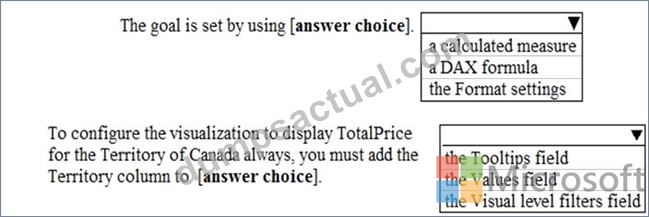
Answer:
Explanation: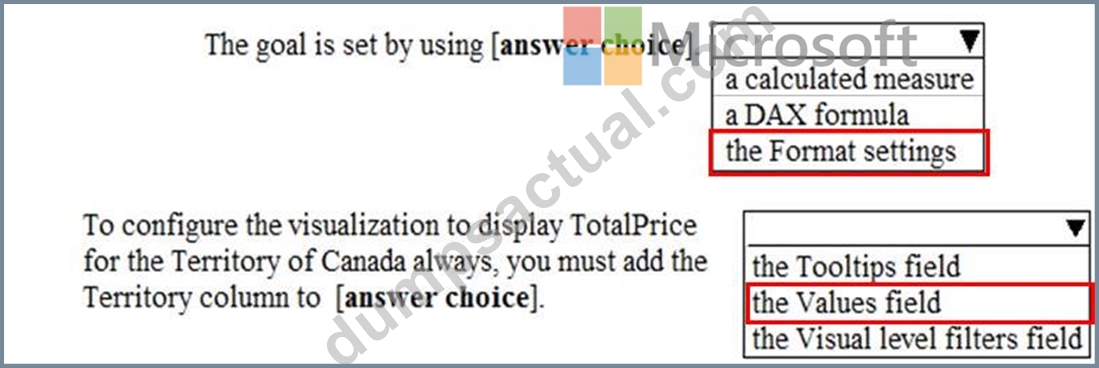
NEW QUESTION # 189
You have two tables named Customers and Invoice in a Power BI model. The Customers table contains the following fields:
CustomerID
Customer City
Customer State
Customer Name
Customer Address 1
Customer Address 2
Customer Postal Code
The Invoice table contains the following fields:
Order ID
Invoice ID
Invoice Date
Customer ID
Total Amount
Total Item Count
The Customers table is related to the Invoice table through the Customer ID columns. A customer can have many invoices within one month.
The Power BI model must provide the following information:
The number of customers invoiced in each state last month
The average invoice amount per customer in each postal code
You need to define the relationship from the Customers table to the Invoice table. The solution must optimize query performance.
What should you configure? To answer, select the appropriate options in the answer area.
NOTE: Each correct selection is worth one point.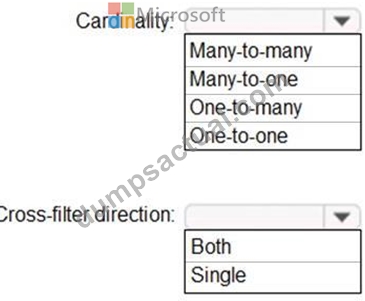
Answer:
Explanation: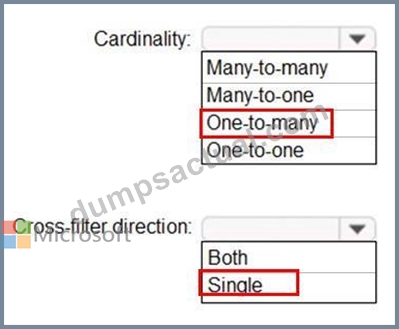
Reference:
https://docs.microsoft.com/en-us/power-bi/transform-model/desktop-relationships-understand
NEW QUESTION # 190
You are creating a dashboard by using the Power Bl service.
You have an existing report page that contains three charts.
You need to add the charts to the dashboard while maintaining the interactivity between the charts.
What should you do?
- A. Pin the report page as a live tile.
- B. Edit the dashboard theme and pin each chart as a file.
- C. Pin each chart as a tile.
- D. Edit interactions in the report and set all interactions to Filter
Answer: A
NEW QUESTION # 191
Exhibit:
You need to create a report that meets the requirements:
* Visualizes the Sales value over a period of years and months
* Adds a Slicer for the month
* Adds a Slicer for the year
Which three actions Should you perform in sequence?
Answer:
Explanation:
Explanation:
NEW QUESTION # 192
You are modifying a Power Bi model by using Power Bl Desktop.
You have a table named Sales that contains the following fields.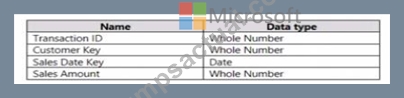
You have a table named Transaction Size that contains the following data.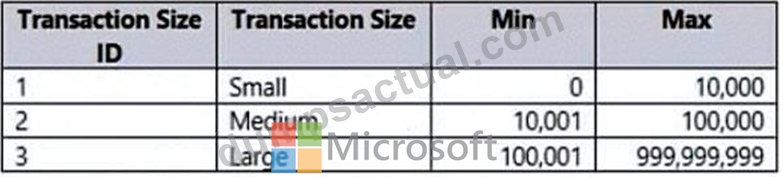
You need to create a calculated column to classify each transaction as small, medium, or large based on the value in Sales Amount.
How should you complete the code? To answer, drag the appropriate values to the correct targets. Each value may be used once, more than once, or not at all.
You may need to drag the split bar between panes or scroll to view content.
NOTE: Each correct selection is worth one point.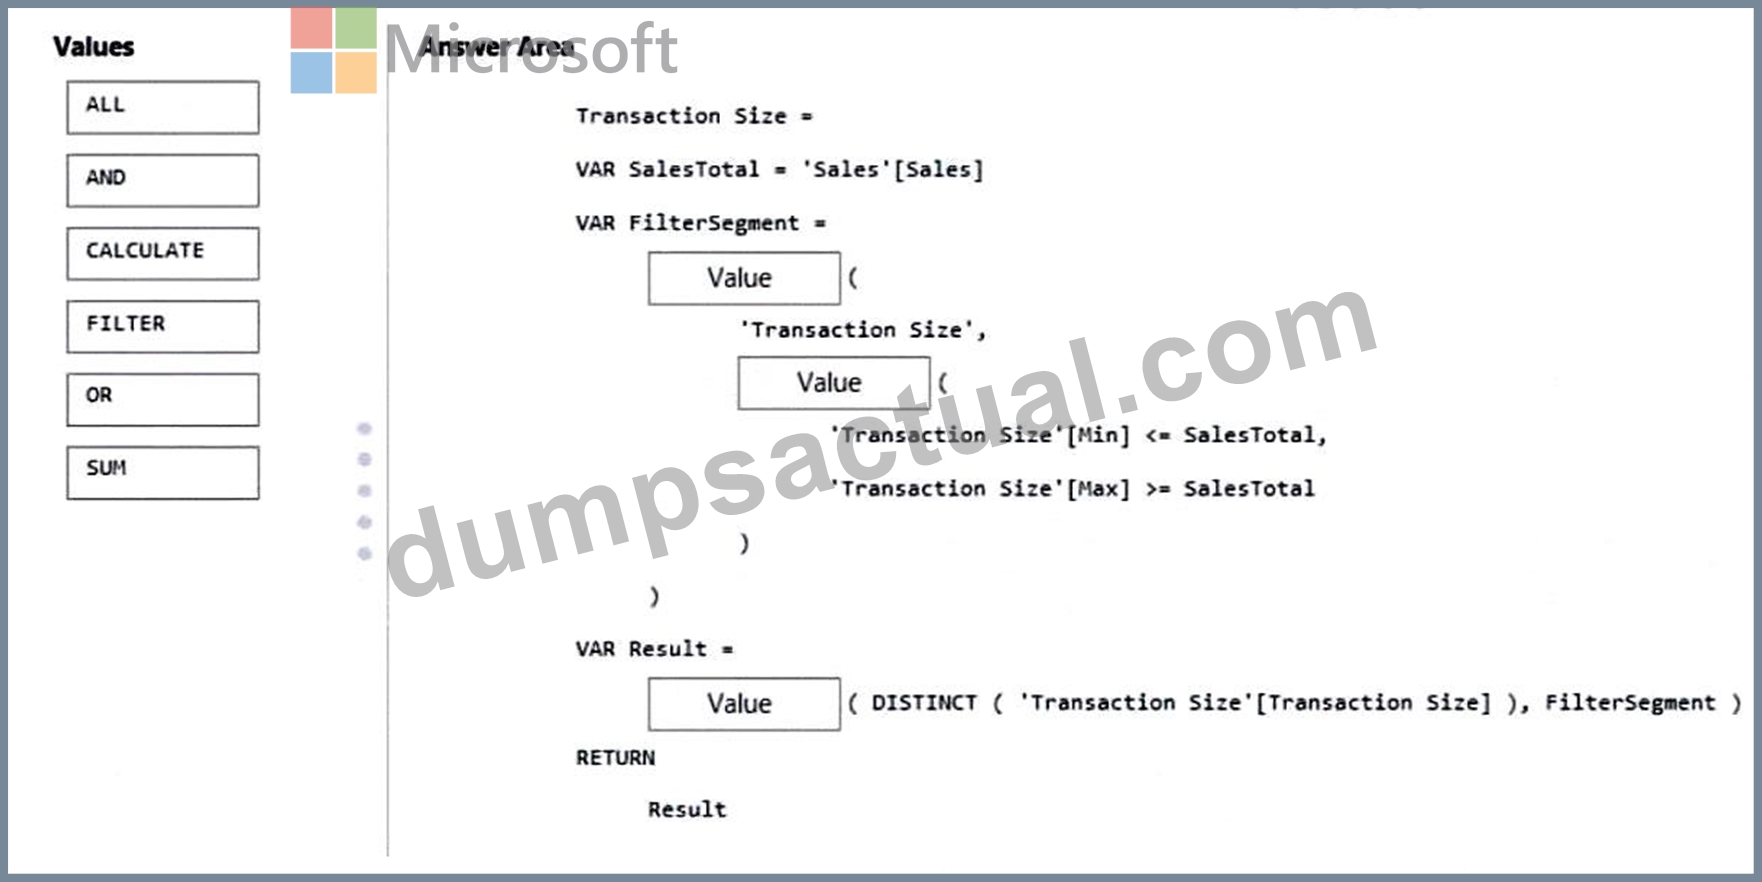
Answer:
Explanation: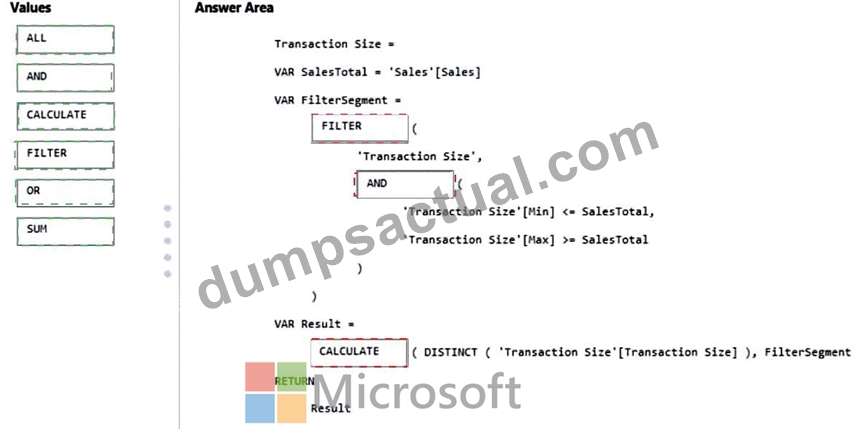
Explanation:
FILTER | AND | CALCULATE
NEW QUESTION # 193
You are using existing reports to build a dashboard that will be viewed frequently in portrait mode on mobile phones.
You need to build the dashboard.
Which four actions should you perform in sequence? To answer, move the appropriate actions from the list of actions to the answer area and arrange them in the correct order.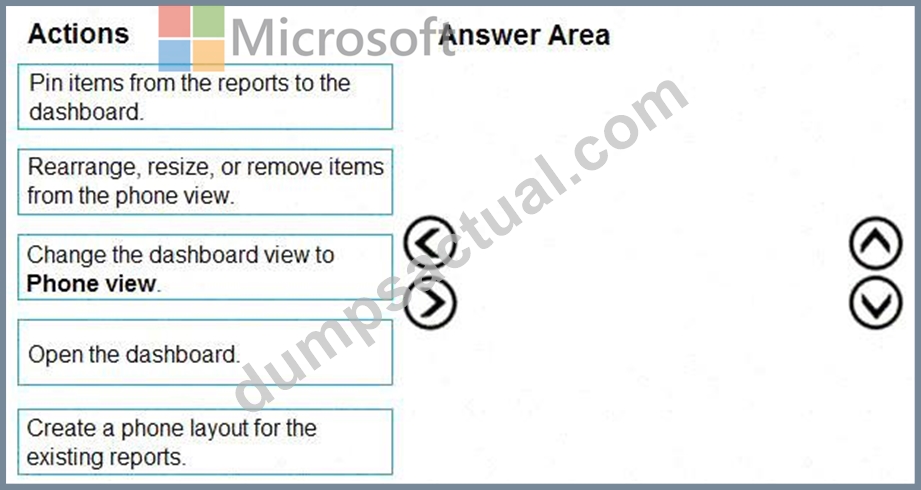
Answer:
Explanation: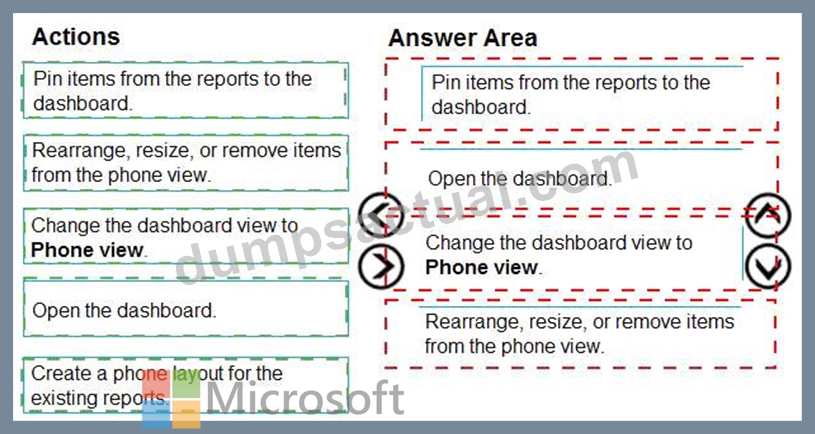
Explanation:
1. Pin items from report to Dashboard.
2. Open Dashboard.
3. Change the dashboard view to Phone view.
4. Rearrange, resize the visuals.
NEW QUESTION # 194
You have a Power B1 semantic model that contains a table
You need to create a Power B1 report page that contains two visuals that meet the following requirements:
* Visual 1: Display* the distribution of hierarchical data
* Visual 2: Search arid then filler by values
Which type should you choose for each visual? To answer, drag the appropriate visual types to the correct visuals. Each visual type may be used once, more than once, or not at all. You may need to drag the split bar between panes or scroll to view content.
NOTE: Each correct selection is worth one point.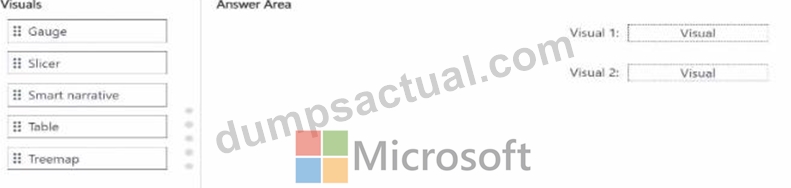
Answer:
Explanation: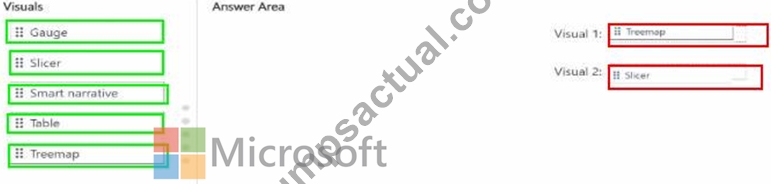
NEW QUESTION # 195
You have a Power BI report that is configured to use row-level security (RLS).
You have the following roles:
- A manager role that limits managers to see only the sales data from
the stores they manage
- A region role that limits users to see only the data from their
respective region
You plan to use Power BI Embedded to embed the report into an application. The application will authenticate the users.
You need to ensure that RLS is enforced when accessing the embedded report.
What should you do?
- A. In the access token for the application, include the report URL and the Microsoft Azure Active Directory domain name.
- B. From dev.powerbi.com/apps, register the new application and enable the Read All Groups API access.
- C. From dev.powerbi.com/apps, register the new application and enable the Read All Reports API access.
- D. In the access token for the application, include the user name and the role name.
Answer: D
NEW QUESTION # 196
You need to address the data concerns before creating the data model .
What should you do in Power Query Editor?
- A. Select the sales_amount column and apply a number filter.
- B. Transform the sales_amount column to replace negative values with 0.
- C. Select Column profile, and then select the sales_amount column.
- D. Select Column distribution.
Answer: C
NEW QUESTION # 197 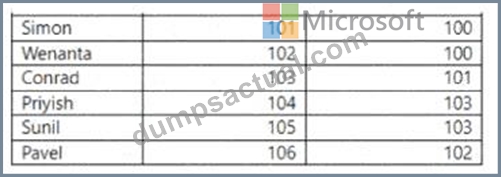
Each employee has one manager as shown in the ParentEmployeelD column,
All reporting paths lead to the CEO at the top of the organizational hierarchy.
You need to create a calculated column that returns the count of levels from each employee to the CEO.
Which DAX expression should you use?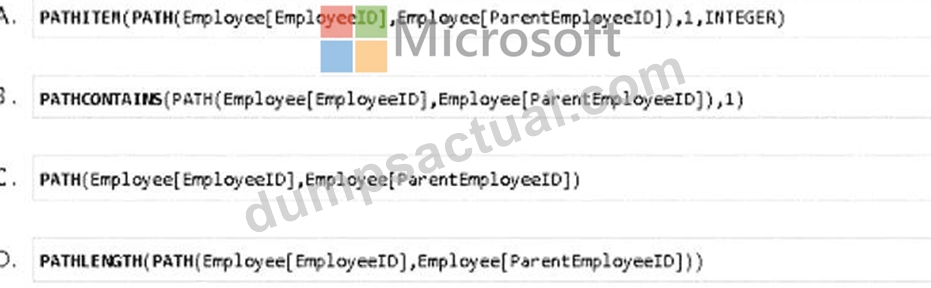
- A. Option A
- B. option C
- C. Option D
- D. Option B
Answer: D
NEW QUESTION # 198
You have an API that returns more than 100 columns. The following is a sample of column names.
client_notified_timestamp
client_notified_source
client_notified_sourceid
client_notified_value
client_responded_timestamp
client_responded_source
client_responded_sourceid
client_responded_value
You plan to include only a subset of the returned columns.
You need to remove any columns that have a suffix of sourceid.
How should you complete the Power Query M code? To answer, select the appropriate options in the answer area.
NOTE: Each correct selection is worth one point.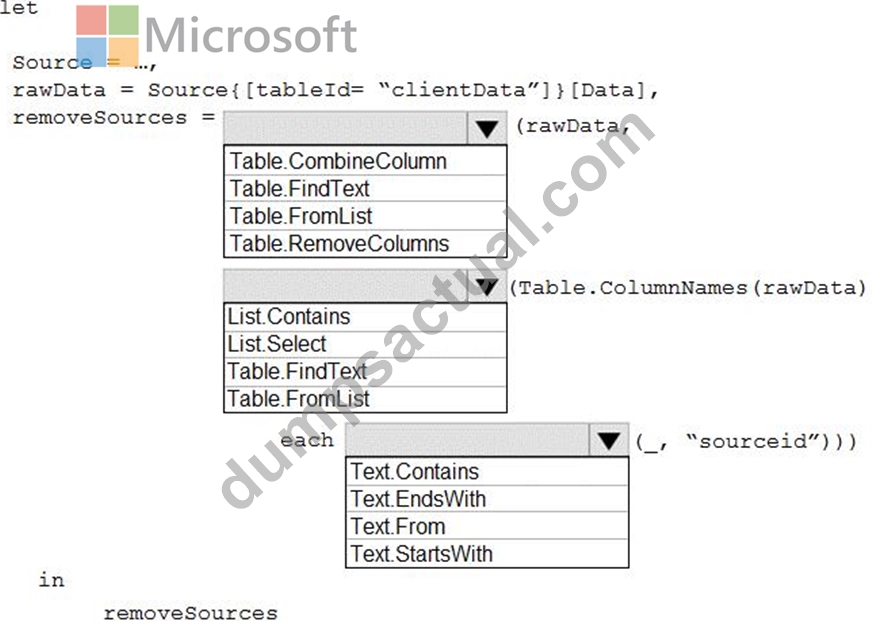
Answer:
Explanation: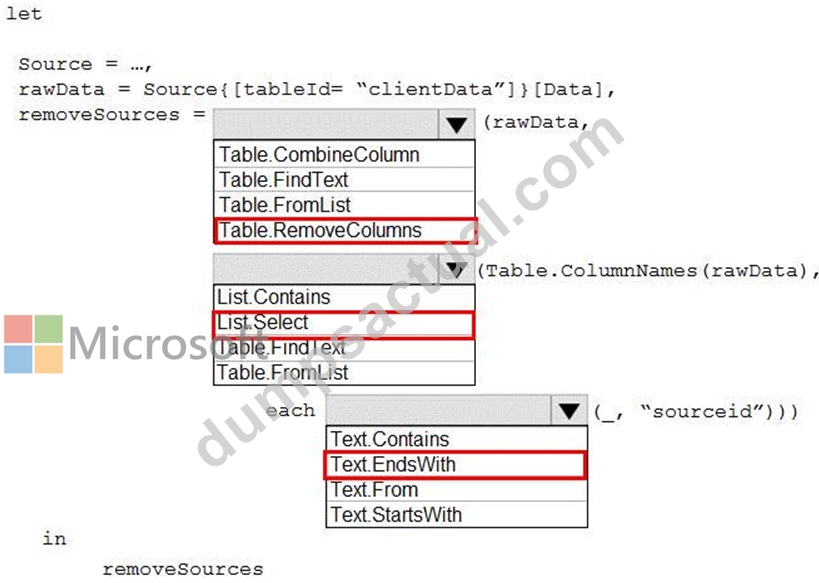
NEW QUESTION # 199
You have a Microsoft Excel workbook that contains two tables.
From Power BI, you create a dashboard that displays data from the tables.
You update the tables each day.
You need to ensure that the virtualizations in the dashboard are updated daily.
Which three actions should you perform in sequence? To answer, move the appropriate actions from the list of actions to answer area and arrange them in the correct order.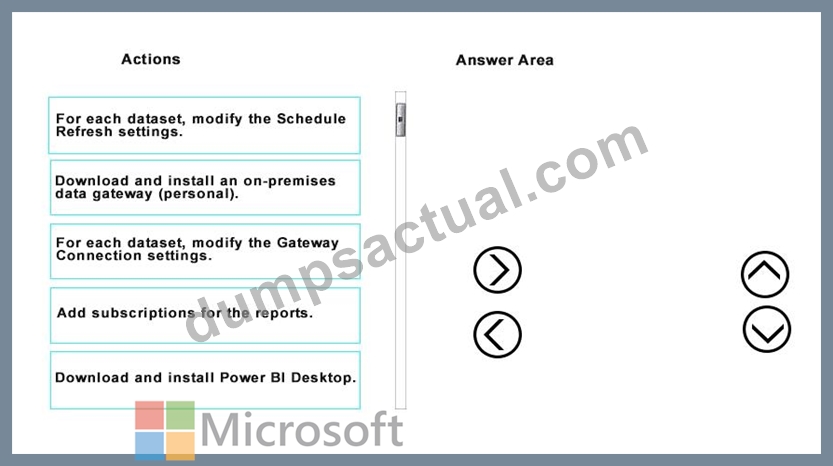
Answer:
Explanation: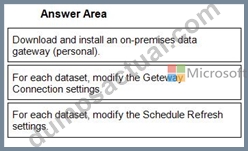
1 - Download and install an on-premises data gateway (personal).
2 - For each dataset, modify the Geteway Connection settings.
3 - For each dataset, modify the Schedule Refresh settings.
NEW QUESTION # 200
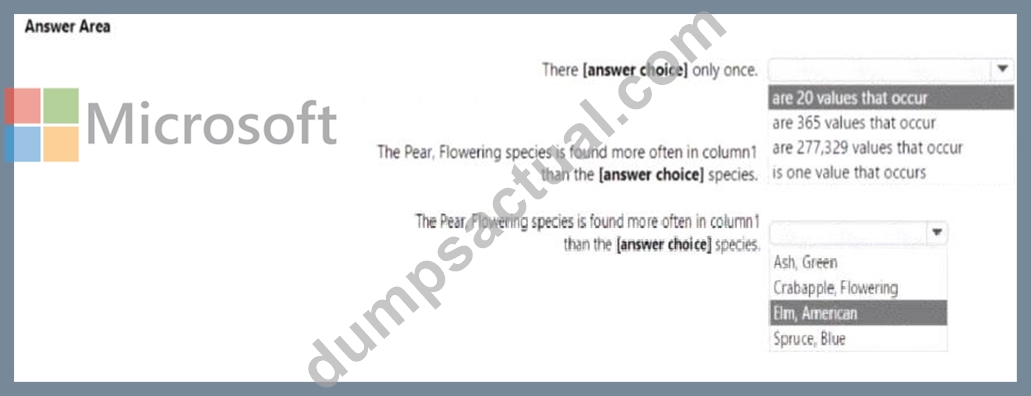
You are profiling data by using Power Query Editor.
You have a table that contains a column named column1. Column statistics and Value distribution for column1 are shown in the following exhibit.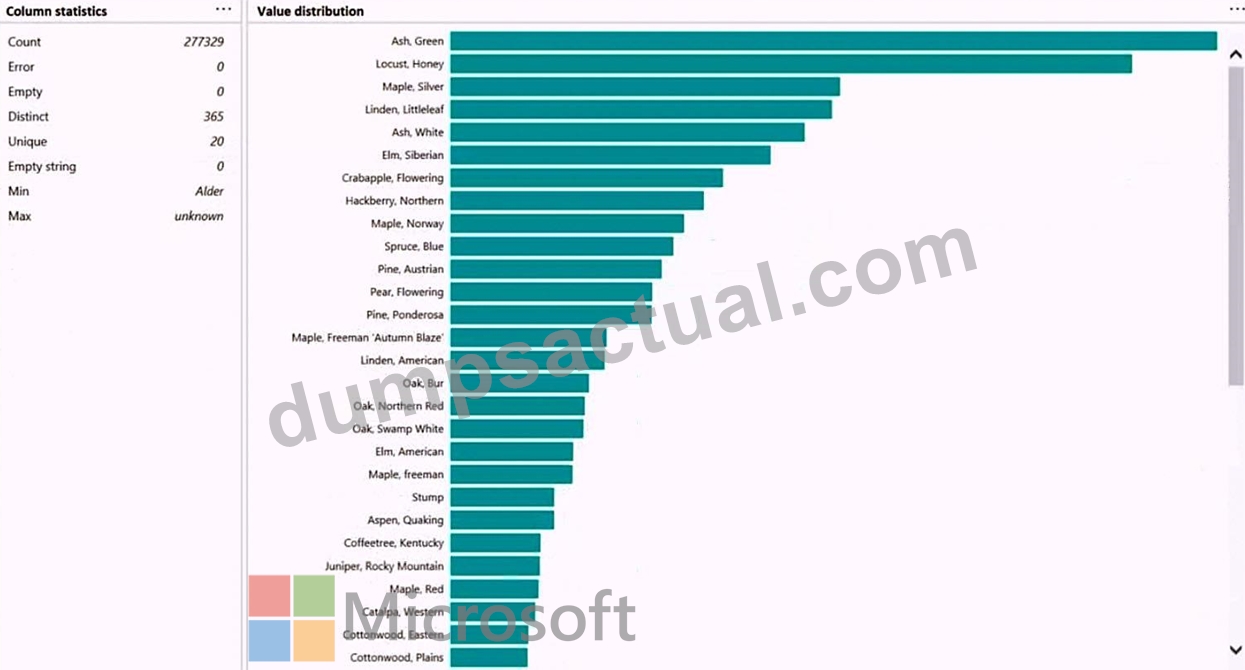
Answer:
Explanation: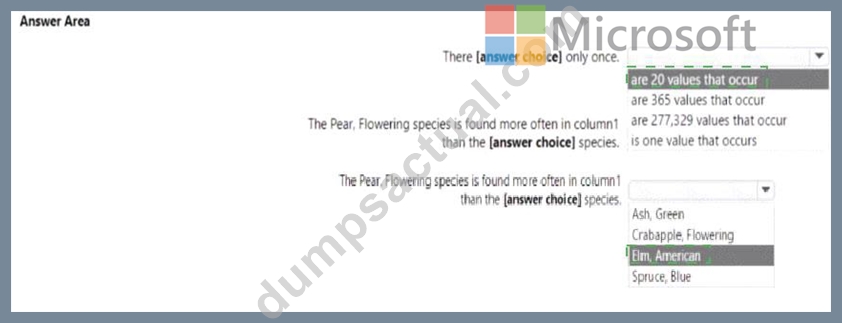
Explanation
NEW QUESTION # 201
You have a Power BI semantic model named Model1 that contains two table named DimDate and FactSales.
There is an active relationship between DimDate and FactSales. DimDate is marked as the date table.
FactSales contains the following data.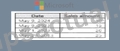
Model1 contains the following measure:
You have a report that uses Model1. The report has a single report page that has a page level filter set to may
9, 2024. The result of the Previous Year measure is displayed in a card visual.
Which value appear in the card visual?
- A. 0
- B. 1
- C. 2
- D. 3
Answer: C
NEW QUESTION # 202
......
Pass Guaranteed Quiz 2026 Realistic Verified Free Microsoft: https://www.dumpsactual.com/PL-300-actualtests-dumps.html
PL-300 Exam Questions - Real & Updated Questions PDF: https://drive.google.com/open?id=141mne0zV3TvJ_Mo2wOsL0HWGotNS3psT
